
You’ve launched your first rewards program, and things seem to be going well. Merchants are funding the rewards and cardholders are redeeming them.
But when you start putting together your QBR slides, you realize there’s really no concrete ROI here.
Yes, you’ve got the redemption rate, activation numbers, and total rewards issued, but that’s not really taking into account how much it cost to get the program stood up, whether cardholders are actually changing their behavior, and whether that behavior is generating sustainable revenue.
Knowing that people are redeeming rewards is a good start. But to show the ROI of a rewards program, you have to prove cardholders are spending more — in terms of AOV and frequency. That requires isolating the lift your program drove from the spend that would have happened anyway. And that requires connecting that behavioral change to numbers your CFO recognizes: interchange revenue, retention rates, LTV by cohort.
Here’s how to do it.
Newer to card-linked offers? Here’s a refresh of what they are and how they work.
The Three-Tier Rewards Program ROI Framework
Most rewards programs get measured at Tier 1 and stop. That's where the data is easiest to pull — but it's also where the least important signals live. True rewards program ROI requires all three tiers working together.
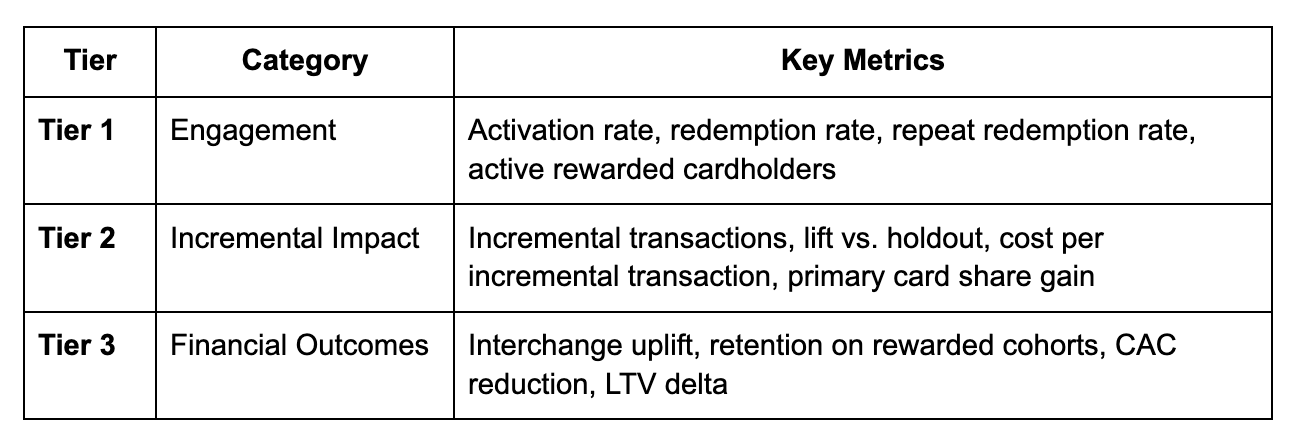
These tiers are sequential. Strong Tier 1 metrics with weak Tier 2 performance means your program is popular but not changing behavior. Strong Tier 2 without Tier 3 tracking means you can prove behavior change but can't tie it to revenue. You need all three.
Tier 1: Engagement Metrics
Engagement metrics tell you whether cardholders are interacting with rewards at all. They're necessary but not sufficient.
Activation rate is the percentage of eligible cardholders who have redeemed at least one offer. Low activation (under 20-30% depending on program maturity) signals a discovery or UX problem, not a rewards problem.
Redemption rate measures the share of offered rewards that get claimed. Track this by offer type, merchant category, and cardholder segment — a flat redemption rate hides which offers are working.
Repeat redemption rate tells you whether cardholders are returning to the same offers. High repeat redemption is a retention signal. A cardholder who redeems the same merchant's offer three or more times is building a habit, not just testing a perk.
Active rewarded cardholders is your base count: how many cardholders are actively engaging with at least one offer per month. Growth in this number, combined with flat or declining overall cardholder count, indicates rewards are driving retention.
Tier 1 metrics are useful for diagnosing program health and optimizing offer mix. They should not be used as primary ROI evidence.
Tier 2: Incremental Impact Metrics
This is where most programs get in trouble. They can’t answer the question: did the program actually change behavior, or did we just reward actions that would have happened anyway?
Run randomized controlled trials (RCTs) to measure lift, splitting audiences into test (80%), control (10%), and reserve (10%) segments. The control group receives no marketing intervention. The difference in outcomes between groups is the true incremental impact.
BM Technologies used this approach and saw a 51% transaction uplift among rewarded cardholders.
That lift data then feeds two metrics that tell you whether the program is actually paying off. Cost per incremental transaction (total program cost / transactions that would not have occurred without the offer) tells you whether you're generating more than you're spending.
Primary card share gain tells you whether your card is capturing a larger slice of total cardholder spend over time. If rewards are working, both numbers move in the right direction.
Tier 3: Financial Outcome Metrics
These are the metrics your CFO will really care about because Tier 3 ties the behavior changes you measure in Tier 2 to revenue, retention, and cost. You need to calculate:
Interchange uplift translates transaction volume gains directly into revenue. When rewarded cardholders transact more frequently or shift spend to your card from competitors, interchange income increases. Atlas, a Kard partner, recorded a 163% lift in customer value — a figure that flows directly from measuring interchange and revenue per rewarded cardholder against baseline.
Retention on rewarded cohorts. Compare 12-month retention rates between rewarded and non-rewarded cardholders. If your rewarded cohort retains at 85% versus 70% for non-rewarded, the delta is worth quantifying in revenue terms: multiply the difference by your average revenue per cardholder and you have a retention ROI figure that stands on its own.
CAC. A program that drives strong word-of-mouth, improves app store ratings from satisfied cardholders, and positions your product as a meaningful alternative to big banks lowers organic acquisition costs over time. This is harder to attribute precisely, but worth including in multi-year ROI models.
LTV. Compare the projected lifetime value of a rewarded cardholder cohort — using retention rate, average annual revenue, and expected tenure — to your non-rewarded baseline. This is the metric that justifies program investment in budget conversations, and it's the one most programs never get to because they stopped measuring at Tier 1.
Want examples of how issuers have translated Tier 2 behavioral data into Tier 3 financial outcomes? Read our issuer case studies.
How to Calculate Rewards Program ROI
Once you have metrics across all three tiers, the ROI formula is straightforward:
ROI = ((Incremental Profit - Total Program Costs) / Total Program Costs) × 100
The challenge here is getting the inputs right.
Computing Incremental Profit
Incremental revenue starts with the lift you measured in Tier 2:
Incremental Revenue = (Post-Program ARPC - Pre-Program ARPC) × Member Count
Where ARPC is average annual revenue per cardholder. Apply your margin rate (typically 25-40% in banking) to get incremental profit.
For a digital bank with 100,000 members: if pre-program ARPC is $180 and post-program ARPC rises to $200, that's $20 incremental lift per member, or $2M in incremental revenue annually. At a 35% margin, incremental profit is $700K.
Aggregating All Program Costs
The most common ROI error is undercounting costs. Include:
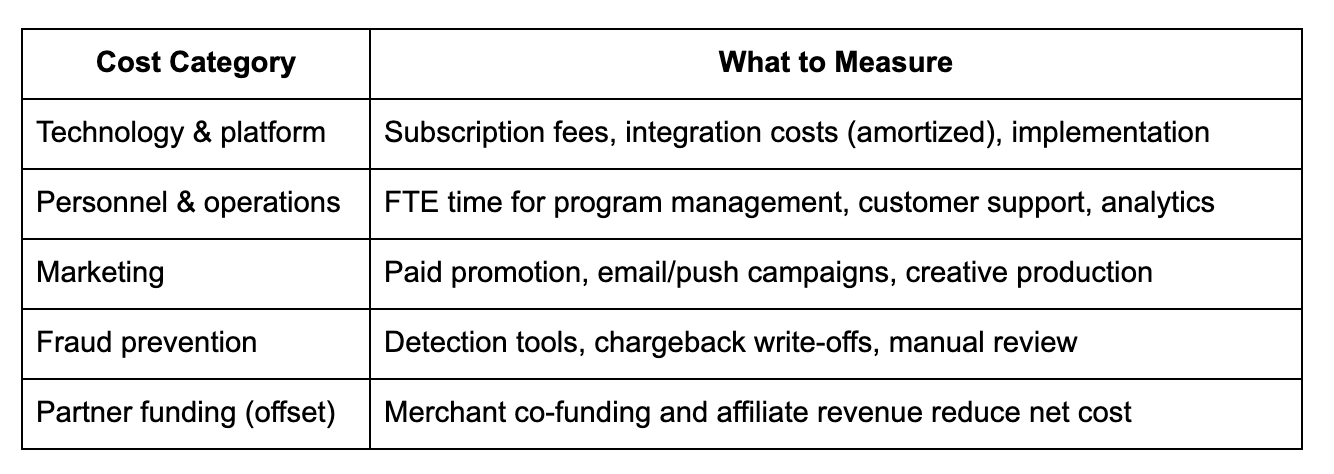
If your program has mature merchant partnerships, partner-funded offers offset a meaningful portion of gross cost. Don't forget to net this against your total.
The Payback Curve
Track cumulative incremental profit versus cumulative costs by period. The point where the profit line crosses the cost line is your payback point. When you hit that depends heavily on engagement ramp speed and initial technology investment.
Plotting this monthly lets you forecast when to expect positive ROI and provides finance teams with a model they can stress-test.
The Six Measurement Mistakes That Distort ROI
1. Measuring revenue instead of incremental revenue
Total member revenue includes behavior that would have happened without the program. Incremental revenue compares member versus non-member cohorts, or pre- and post-enrollment behavior, to isolate what the program actually drove. Without this discipline, ROI calculations systematically overstate returns.
2. Undercounting costs
Five costs that get missed most often: integration labor connecting your platform to banking and card systems, customer support overhead for redemption inquiries, fraud prevention tools and write-offs, finance team time for accounting compliance, and opportunity cost of reward margin compression on transactions you would have captured anyway.
3. Attribution gaps without control groups
Without a holdout group established before launch, you're measuring correlation, not causation. Natural spend growth during a strong economic period can look like rewards-driven lift.
Hint: Implement control cohorts before the program goes live, not after results come in and someone questions the numbers.
4. Data quality failures
Rewards program ROI is only as accurate as the transaction data feeding it. Common failure modes: batch-based reporting that delays attribution, member-to-card linkage errors, duplicate transaction counts, and merchant category code misclassification.
Real-time transaction validation — confirming that every rewarded transaction belongs to an eligible member, matches a valid offer, and occurred within the offer window — is what you really need.
5. Cannibalization effects
A program that shifts when cardholders spend rather than increasing total spend shows positive engagement metrics while generating no incremental revenue.
Make sure to measure this with long lookback windows. For example, 6-12 months pre-program baseline, active offer window, then 3-6 months post-offer observation.
That way, if spend drops back to baseline after the offer ends, you're looking at pull-forward, not behavior change.
6. Integration complexity breaking closed-loop measurement
When your offer engine, core banking system, card processor, CRM, and analytics tools don't share data in real time, closed-loop measurement becomes impossible.
Every handoff between systems is a potential attribution gap. API-first rewards platforms solve this by connecting directly to existing banking infrastructure — producing real-time offer exposure tracking, immediate transaction ingestion, and a unified data model across marketing and payments.
What Good Attribution Infrastructure Looks Like
The technology stack underneath your measurement matters as much as the methodology. At minimum, closed-loop rewards measurement requires:
- Real-time transaction ingestion and validation
- Member-to-card-to-transaction linkage at the record level
- Offer impression tracking connected to transaction outcomes
- Holdout group management for ongoing RCTs
- Unified reporting across marketing, payments, and finance
When evaluating a rewards platform or CLO partner, ask how they handle each of these. Most can’t produce offer-level attribution (showing you which specific offer drove which specific transaction for which specific cardholder).
Making the ROI Case Internally
Finance teams respond to three things:
- A clear methodology they can audit
- A cost model they can stress-test
- Comparable evidence from peer institutions
On methodology: define your measurement approach and KPIs before launch, not after. Get finance and marketing aligned on the same baseline ARPC, the same incremental lift calculation, and the same cost inputs. If you measure rewards ROI one way and your CFO calculates it another way, the program will always look worse than it is.
On cost modeling: build the payback curve into your proposal. Show when the program turns cash-flow positive, what assumptions drive that timing, and what happens to the curve if engagement ramps slower than projected.
On peer evidence: issuers using merchant-funded rewards have demonstrated 20x returns on program investment in specific cohorts. That's not a universal benchmark, of course, but it shows that with the right merchant mix, high cardholder engagement, and mature attribution infrastructure, you definitely can show real ROI (and optimize your program over time).
Read how Atlas increased average customer value by 163% with Kard.
Don’t Sleep on Rewards ROI
Rewards program ROI is a powerful metric that can reveal program effectiveness and can specifically tell you how your program is generating revenue, retention, and lifetime value.
Achieving a high ROI is all the more possible with strong API platforms. Kard’s API-driven platform allows fintechs and FIs to compete with the biggest banks and loyalty programs, while giving merchants a scalable channel for engagement. By linking brand exposure directly to verified online and in-store purchases, Kard proves incremental impact at scale.
Book a demo to see how easy it is to stand up a standout rewards program with Kard.
Frequently Asked Questions
How do you prove rewards program incrementality beyond correlation?
Randomized controlled trials (RCTs) are the standard. Divide your audience into test and control groups before the program launches. The test group receives offers and the control group does not. The difference in transaction frequency, spend per period, and ARPC between groups — measured over the same window — is your incremental impact.
What costs do financial services teams most often miss in ROI calculations?
Integration labor is the biggest one. Connecting a rewards platform to core banking, card processing, and analytics systems is time-intensive and rarely shows up in vendor quotes. Also commonly missed: customer support overhead for redemption issues, fraud detection tools, finance team time for compliance accounting, and the margin erosion on transactions you would have captured without an offer.
Should ROI include customer acquisition value or only retention economics?
Measure both, but report them separately. Retention ROI = incremental profit from existing members divided by program costs. Acquisition value = new cardholder economics generated by referral or differentiated product positioning. Blending them overstates retention ROI and understates acquisition ROI.