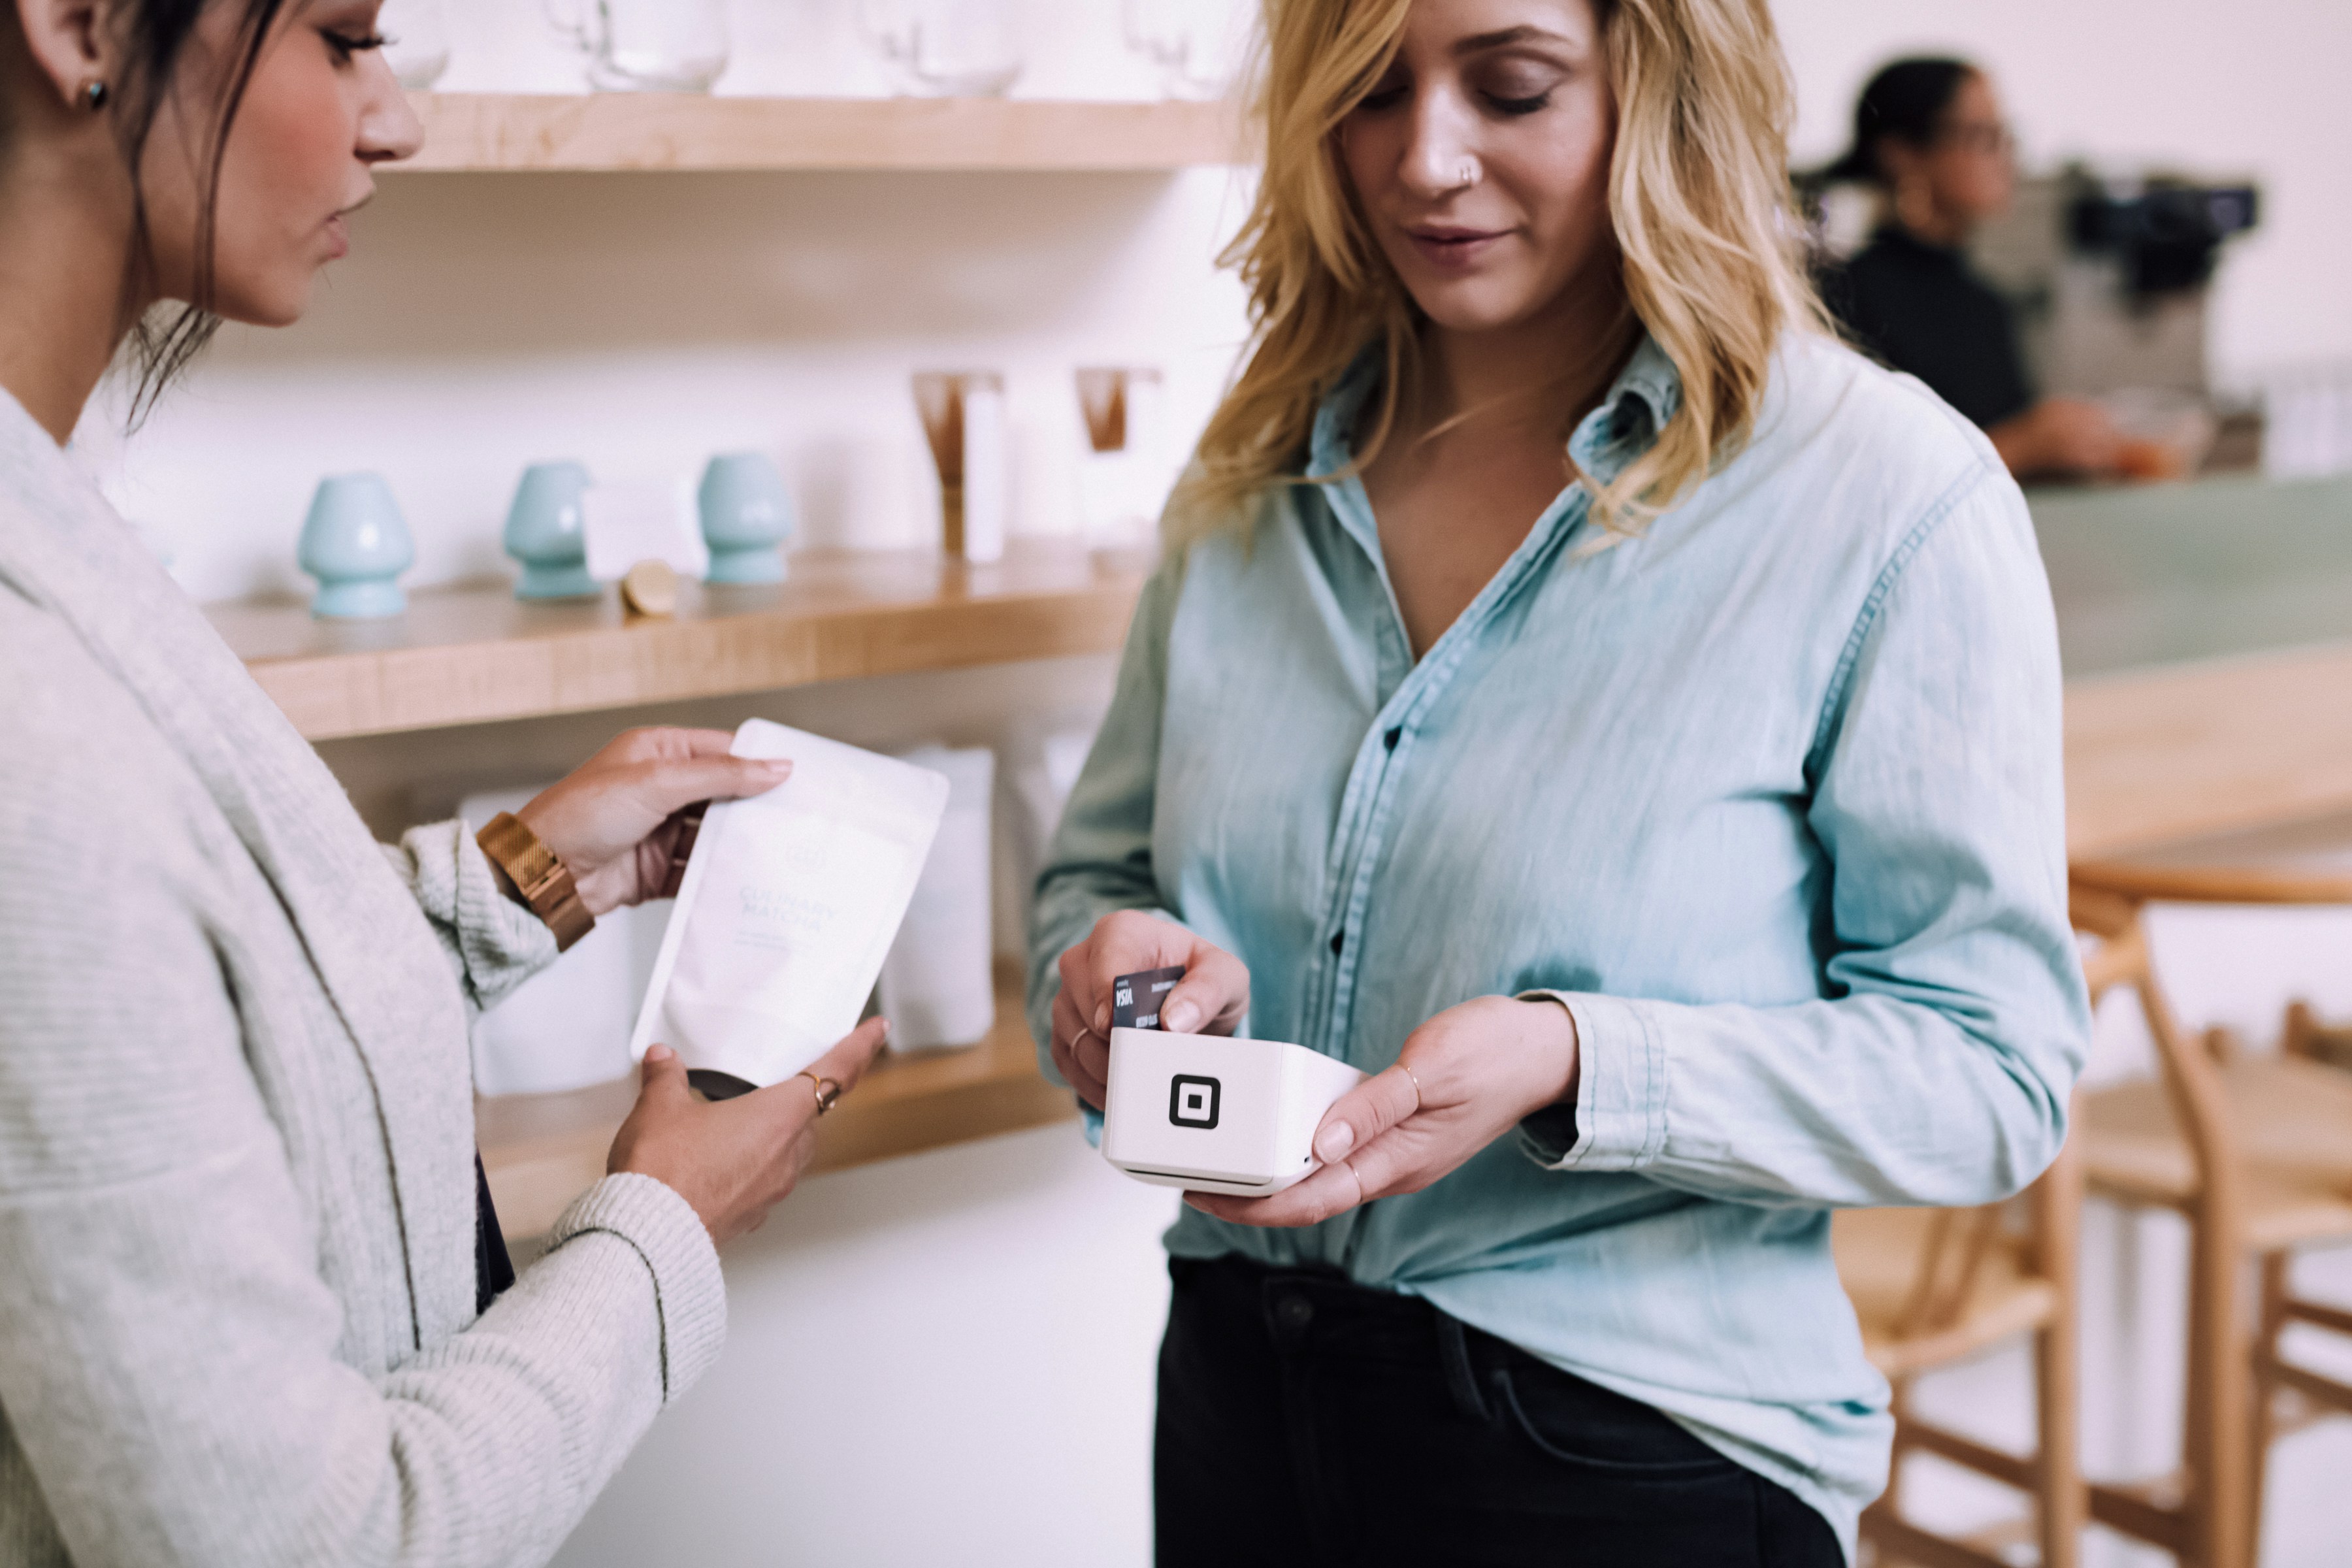
Ask a room full of shoppers whether they buy on impulse, and maybe a few hands go up. Their card statements, however, tell a different story:
- 3 food delivery orders since Monday
- $12 of gum, lip balm, a Snickers, and Chomps at the grocery store on Sunday
- A streaming service they were sure they canceled in March
Understanding how customers buy is the name of the game in marketing. But asking people what they think through surveys is a whole lot different than studying their actual behavior. People forget what they did yesterday, let alone a week or a month ago. They might round up, they might describe the shopper they aspire to be.
The difference between what they’re telling you and what they do can make your campaigns fall flat. Transaction data closes the gap, telling you what someone bought, where, when, and how much they spent.
For the past two years, we’ve dug into billions of dollars worth of transactions to mine some patterns. Here’s what we know about how consumers spend.
Transaction Data vs. Surveys and Cookies
Surveys Capture What People Say
Surveys ask people to remember and answer honestly. Ask younger shoppers what drives their decisions and they might say price. But for big ticket items that match their values, our data says they’re willing to pay top dollar.
Plus, unless you’ve got big bucks to spend, your panels aren’t that big, which means your data’s not that accurate.
Cookies Capture What People Click
First of all, the websites you browse and even what you click isn’t necessarily reflective of what you buy. Just go look at your own browsing history.
Second, cookies only track online behavior. And they degrade a little more every quarter under privacy rules and a deprecation timeline that keeps shifting. In short, cookies are merely a hint, and they’re slowly fading away, which is why you need to build up a wealth of first-party data or partner with a platform that has it.
Transactions Capture What People Do
First-party transaction data is deterministic. It’s not a model trying to guess whether someone will buy something. A person actually bought something, and you find out how much they spent.
Independent commerce media networks track spend for tens of millions of cardholders, meaning they have a broad sense of where shoppers have swiped their cards, and how much they spend.
3 Things Transaction Data Tells You
1. When People Spend
Common sense says people spend more on weekends. They have free time, they’re out with their family and friends, they’re going to spend a little here and there.
Which they do. But the data shows that they spend even more during the week.
In 2024, the average daily spending was 27% higher on weekdays than on weekends. In 2025, there was an even bigger difference: 46%, particularly in financial services, entertainment, telecom, travel, and health & wellness categories.
What you can do with this information:
- Run day-specific promotions and rewards-based offers to encourage consumers to buy online or in-store.
- Optimize when these ads are shown, perhaps on Sunday or Monday, to drive purchases during the week.
Transaction data will also tell you when people spend throughout the year. While you’d think a bulk of the buying happened during the holiday season, for most categories, that’s not true.
Spend is relatively consistent across all seasons in our dataset:
- Spring: 24.77% total spend
- Summer: 24.95% total spend
- Autumn: 25.83% total spend
- Winter: 24.45% total spend
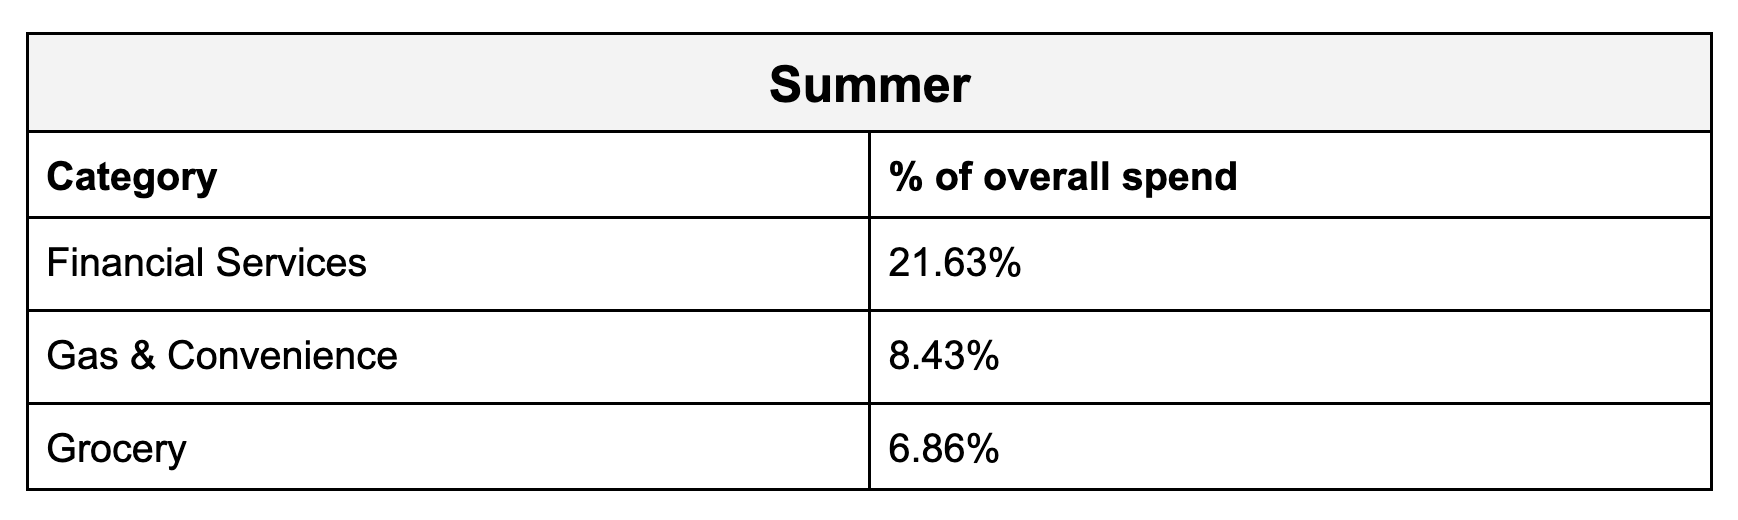
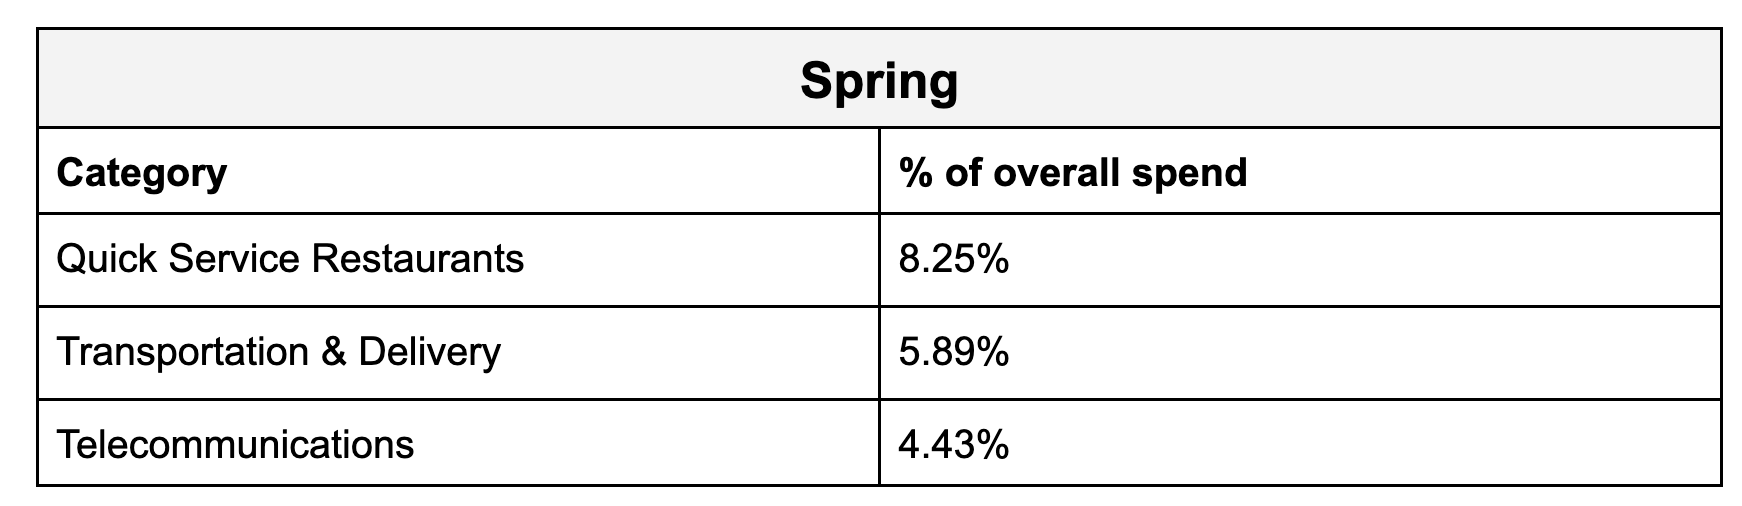
And for many of the categories with the highest share of spend, summer and spring were big spending seasons:
What you can do with this information:
Maximize your budget. Instead of blowing it all on sky-high CPCs during the holiday season, focus on pay-for-performance brand awareness strategies, like rewards-based marketing. That way, people think of your brand when they’re thinking about splurging.
2. Where Else Customers Shop
At Kard, we’re tracking roughly $70B in transaction volume for Gen Z and Millennial buyers. That broad of a first-party dataset tells us a lot about where consumers spend their money — not just whether they spend at our customers’ stores.
Last year:
→ Big box retailers accounted for 20% of total spend, beating out next spend categories by 12%+.
→ The grocery vertical showed substantial activity, too, making up 7% of total spend. As you might imagine, Kroger and Publix were at the top of the pack.
→ Quick serve restaurants (8%), gas & convenience (8%), and transportation (6%) account for 22% of total cardholder spend.
→ Discretionary purchases, like vacations, hobbyist equipment, and clothes, are where they drop the most money with travel, sporting goods, fashion, and home goods leading the way: $131, $72, $56, and $54 AOVs, respectively.
What you can do with this information:
- If you’re not selling at or through these stores, push harder to get your foot in the door (especially at up-and-coming big box, grocery, and discount stores).
- Figure out what makes your product “splurgeable” — aka very cool, valuable, and desirable — and how to encourage that splurge.
- Launch cash back offers (particularly on high AOV products) to give people the nudge they need to convert.
3. How People Pay
Most brands know their own checkout mix. What they can't see is how their customers pay everywhere else, and how fast it's changing.
Because we track debit, credit, and EBT card transactions, as well as receipt data, we know that consumers rely heavily on their cards for everyday necessities.
What you can do with this information:
Differentiate yourself, especially in essential categories (health & wellness, big box, gas & convenience, grocery), where repeat behavior is high. Try:
- Accepting credit cards, debit cards, and digital wallets. At least 65% of shoppers said they used or wanted to use preferred payment methods and rewards during their most recent purchase. Partnering with performance-based rewards platforms that already have networks of banking apps, rewards platforms, and fintech services that young consumers use can expand the audience your brand reaches (and boost your revenue).
- Accepting alternative payment methods. Alternative payment methods gained significant share throughout 2025, with the financial services category growing steadily throughout 2025 (reaching over $8B), suggesting consumers prefer a seamless and frictionless buying experience. PYMNTS found that 18% of Gen Z use buy now, pay later (BNPL) products alongside other pay-later methods, compared with 12% of older consumers.
- Offering cash back rewards. A survey by IPSOS found that 70% of Americans prefer to pay by credit or debit to earn rewards or points. 65% of Americans open a new credit card specifically for the rewards it offers.
TL;DR: Deterministic Purchase Data is a Valuable Signal
It is behavioral. It records what someone did, not what they said they might do.
It reveals someone’s overarching spend behavior across merchants, not just the slice inside your store.
Best of all, it’s provable. Because every data point is a settled transaction, you can measure lift against real purchases instead of inferring it from clicks. You know that your campaigns, specifically, are what encourage someone to buy — they wouldn’t have bought anyway.
Everything else is a proxy.
How to Turn Transaction Insights Into Action
These insights are worthless if they just stay in a slide. The trick to seeing great results from your own first-party transaction data or from a rewards demand platform is turning those aha moments into real campaigns.
Here are 4 ideas:
1. Build audiences from verified spend
Recency, frequency, category mix, and lapse windows, not stated preferences. A lapse window beats a lookalike. Someone who bought in your category last month and has gone quiet since is a warmer target than anyone a model guessed at.
2. Time offers to real routines
Day of week, season, and post-purchase sequences beat a generic always-on blast. Send the grocery offer mid-week. Hold the discretionary push for January. Structure it to earn a second purchase: a tiered cash back that pays more on the first order and steps down on the next two pulls people back and lifts average order value at the same time. A flat coupon does neither.
3. Measure against posted transactions, not impressions or clicks
If it did not show up in spend, it did not happen.
4. Reach buyers where intent already lives
The banking and fintech apps people open every day are a channel, not an afterthought. Merchant-funded, personalized cash back offers inside those apps ensure your offer meets verified spend instead of chasing a click.
These strategies work in practice:
- A footwear brand running a 5% cash back offer through our network gained 35% more market share in a few months.
- A food delivery platform brought in 10,000 new customers and reactivated 6,000 lapsed ones in seven weeks, timed to a stretch when younger buyers were already primed to order.
- A popular tax prep software increased transaction volume by 94% in one year with Kard’s cash back rewards
Stop Guessing What Your Customers Want
Optimizing around what people say and what they click can only take you so far. Transaction data is the closest you get to reading someone’s mind.
Want a full breakdown of:
- What motivates Gen Z and Millennials to buy, switch brands, and stay loyal?
- Where younger consumers are spending across categories like big box, grocery, QSR, and travel?
- How payment preferences and rewards influence purchase decisions?
- What you can do to drive engagement, conversion, and long-term loyalty?
Download the full 2026 Modern Consumer Journey report.